2026 Election Tracker
California Election Odds - 2026 Live Betting Odds & Voting History
California 2026 election odds for the wide-open June 2 governor primary to replace Newsom, the Prop 50 redistricting fight, plus every House race.
| Electoral votes | 54 (most in U.S.) |
|---|---|
| 2024 presidential result | Harris 58% / Trump 38% (D+20 margin) |
| Current governor | Gavin Newsom (D), term-limited |
| U.S. senators | Alex Padilla (D, next election 2028), Adam Schiff (D, next election 2030) |
| 2026 races on the ballot | Governor (open seat), all 52 U.S. House seats under new Prop 50 map |
| Cook PVI | D+13 |
The largest state in the country was also one of the most active prediction-market battlegrounds of 2026, and not for the reasons you might expect. California will not change hands in the November general election, it gave Kamala Harris a 20-point win in 2024 and has been reliably Democratic at the federal level since 1992. The story was the June 2, 2026 top-two primary, where 61 candidates ran for governor in a wide-open race to succeed term-limited Gavin Newsom. In a fragmented field where no candidate cleared 30%, Republican Steve Hilton and Democrat Xavier Becerra emerged as the top two, with billionaire Democrat Tom Steyer running third. The Associated Press had not formally called the order as of this writing, and California counts mail ballots postmarked by Election Day for several days afterward, so the margins will continue to shift, but Hilton and Becerra were positioned to advance to a one-on-one November runoff. Polymarket tracked nearly $20 million in volume on California gubernatorial markets, more than any other state's gubernatorial market this cycle. National 2028 markets and balance-of-power coverage live on ElectionOdds.com.
Is California a Red State or a Blue State?
California is one of the bluest states in the country. Democrats have won every California presidential election since 1992 and every statewide elected office since 2010. Kamala Harris carried California by 20 points in 2024, Joe Biden won it by 29 in 2020, and Hillary Clinton won it by 30 in 2016. Cook PVI rates California D+13. The state has not elected a Republican governor since Arnold Schwarzenegger in 2006, and Democrats hold supermajorities in both chambers of the state legislature.
California's blue status is relatively recent. As recently as 1988, the state voted Republican for president in George H.W. Bush's election. Republicans held the governorship for most of the 1990s and early 2000s under Pete Wilson and Schwarzenegger. The 1994 Proposition 187, which sought to bar undocumented immigrants from public services, is widely credited with permanently alienating California's growing Latino population from the Republican Party. The state moved from a Republican-leaning swing state in 1988 to a safe Democratic state by 1992 and has not been competitive since.
The state's voting pattern reflects its size and concentration. The Bay Area (San Francisco, San Mateo, Alameda, Santa Clara counties) votes Democratic by margins exceeding 70 percent. Los Angeles County, the largest in the country, votes Democratic by roughly 30 points. Orange County, once the Republican heartland, narrowly went for Harris in 2024. The remaining Republican strength is in the Central Valley agricultural counties and the rural Northeast, but these regions are not large enough to compete with the coastal population centers.
California sends 52 House members to Congress, the most of any state, with a roughly 43D-9R split after the 2025 mid-decade redistricting that Governor Gavin Newsom pushed through as a counter to the Texas redraw. The state has 54 electoral votes for the 2028 election, expected to drop to 52 after the 2030 census reflects the state's recent population losses. California has not been considered competitive at the presidential level in any of the last eight election cycles.
Will California become competitive? No, not on any realistic horizon. The state's demographics, urbanization, and party registration patterns all point in the same direction. Republicans last held the governorship over 15 years ago, and the party's statewide voter registration share has continued to decline. A Republican California in 2028 would require something closer to a national political earthquake than a normal election cycle. For a full state-by-state comparison, see the red states vs. blue states map.
California Governor Betting Odds
The Democratic field collapsed in April 2026 when former Representative Eric Swalwell, then a co-frontrunner, exited the race after multiple credible allegations of sexual assault from women who came forward over a compressed period. He suspended his campaign on April 12, announced his intention to resign from Congress on April 13, and formally left office on April 14. His departure scrambled what had been a settled top tier of Democratic candidates and re-opened a fight for the Democratic lane on June 2.
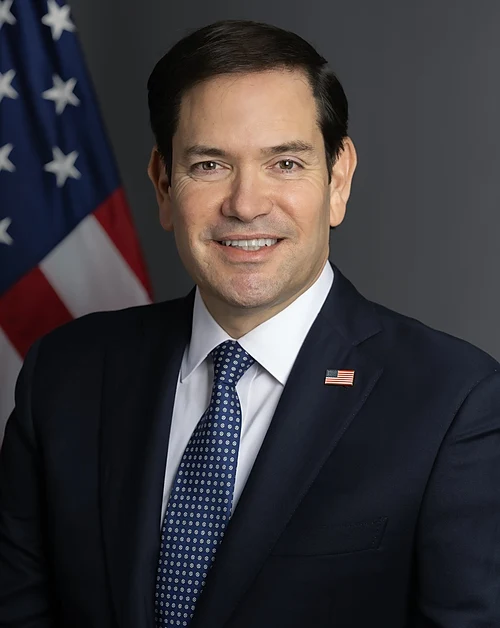
In the June 2 top-two primary, Republican Steve Hilton and Democrat Xavier Becerra finished as the top two, with Hilton drawing roughly 28% and Becerra about 26% in the early count. Billionaire Democrat Tom Steyer ran third at about 20%, and Republican Chad Bianco followed at about 11%. The widely discussed scenario of two Republicans advancing did not materialize, as the Democratic vote consolidated enough behind Becerra to lift him into second. Former Los Angeles Mayor Antonio Villaraigosa, San Jose Mayor Matt Mahan, and former Rep. Katie Porter all conceded as the results came in. Because California counts late-arriving mail ballots, the order was not certified as of this writing, but the matchup was on track to be Hilton against Becerra in November.
Xavier Becerra, the former Secretary of Health and Human Services and former California attorney general, consolidated the Democratic vote in the closing weeks and finished as the top Democrat. Billionaire Tom Steyer, who spent more than $200 million of his own money on the campaign and ran on raising corporate taxes and challenging the state's investor-owned utilities, finished third and did not concede on election night, saying he wanted to wait for additional ballots to be counted. Former Rep. Katie Porter, the law professor from Orange County, conceded after trailing the leaders, ending a campaign that had stalled amid scrutiny over viral videos and a clash with the state's largest labor federation over California's agricultural overtime law.
Steve Hilton, the former Fox News host who carries Trump's endorsement, led the field in the primary and is running as a conservative who has vowed to cut income taxes, ease environmental regulations, and expand oil drilling. He consolidated more of the Republican vote than Riverside County Sheriff Chad Bianco, who finished fourth. Hilton's first-place finish sets up a likely November runoff against Becerra in a state no Republican has won statewide since 2006, where registered Democrats outnumber Republicans by nearly five million. See more about other Governor races here.
Republicans have not won a statewide race in California since 2006.
Governor
2 marketsGovernor primary
2 marketsCalifornia Governor Election History
California's governorship was genuinely competitive between the parties within living memory. Republican Pete Wilson won two terms in the 1990s, and after Democrat Gray Davis won in 1998 and 2002, voters recalled him in the historic 2003 recall election and replaced him with Republican Arnold Schwarzenegger, who then won a full term in 2006. That 2006 win remains the last time a Republican captured a statewide race in California.
Since Democrat Jerry Brown returned to the office in 2011, the governorship has been firmly Democratic. Gavin Newsom won in 2018, decisively defeated a 2021 recall attempt, and won re-election in 2022. The 2026 race is the first open-seat contest since 2018, and it drew a 61-candidate field after the collapse of early Democratic frontrunner Eric Swalwell. The June 2 top-two primary sent Republican Steve Hilton and Democrat Xavier Becerra to the November runoff, with Becerra favored given the state's heavy Democratic lean.
California Senate Betting Odds
Neither of California's U.S. Senate seats is up in 2026. Alex Padilla, who was appointed to fill Kamala Harris's seat in January 2021 and then elected to a full term in 2022, is next on the ballot in 2028. Adam Schiff, who won the special and general elections in 2024 to fill Dianne Feinstein's seat, is next up in 2030.
For betting markets, this means California Senate activity in 2026 is limited to the 2028 horizon, early speculation on whether Padilla will face a serious primary challenge from his left, whether he might run for governor or president instead of seeking re-election, and whether the political environment in 2028 will be more or less favorable to incumbent Democratic senators than the current cycle. None of these markets has produced significant trading volume yet, but they tend to activate after the November 2026 results clarify the national landscape. See all Senate election odds here.
California U.S. Senate Election History
For more than three decades, California's Senate seats were held by Democratic women, Dianne Feinstein and Barbara Boxer, who won their seats in the early 1990s and served for a generation. Under the state's top-two primary, adopted in 2010, Senate races have sometimes pitted two Democrats against each other in November, as in 2016 when Kamala Harris defeated fellow Democrat Loretta Sanchez for Boxer's open seat.
Both seats are Democratic today. Alex Padilla was appointed in 2021 to fill Harris's seat when she became vice president, becoming California's first Latino senator, and won a full term in 2022. Adam Schiff won Feinstein's former seat in 2024 after her death, defeating Republican Steve Garvey. Neither is up in 2026, Padilla next runs in 2028 and Schiff in 2030, so the Senate sits out this cycle while the open governorship and the 52 House seats carry California's electoral action.
California House Betting Odds
California's congressional delegation will be elected in 2026 under new district lines drawn after Proposition 50 passed with 64% support in a special statewide election on November 4, 2025. Prop 50 temporarily suspended the powers of the California Citizens Redistricting Commission, a body created by voters in 2010 to take partisan politics out of mapmaking, and authorized the state legislature to draw new congressional maps through 2030. Governor Newsom and Democratic leaders framed the measure as the "Election Rigging Response Act," explicitly a counter to mid-decade Republican redistricting in Texas, Missouri, and now Florida.
The new map redraws several California districts to incorporate larger shares of urban and suburban Democratic voters, converting up to five Republican-leaning seats into Democratic-leaning ones. Republicans currently hold nine California House seats. The map went into legal challenge immediately after passage. A three-judge federal panel upheld the map 2-1 in January 2026, and the U.S. Supreme Court declined to hear the appeal, exhausting Republican legal options against the map itself. The new lines are in effect for the 2026 primary on June 2 and the general election on November 3.
Prediction markets are pricing California's House outcomes on two layers: which specific incumbents will win or lose their newly-drawn districts, and whether the Democrats can convert the map's structural advantage into the four or five seat pickups it was designed to produce. A separate market tracks the special election in CA-1, the seat that opened when Republican Doug LaMalfa died, that election uses the old district boundaries and runs on the same June 2 primary date.
There is also a separate California-specific layer worth tracking: ballot measures filed by Republican activists seeking to undo Prop 50 in future cycles, and a parallel constitutional amendment from former GOP gubernatorial candidate Carl DeMaio that would bar state lawmakers who voted for Prop 50 from running for office for ten years. Neither has qualified for the ballot yet, but both are generating speculative market activity. See all house of representatives election odds.
U.S. House districts
44 marketsCalifornia U.S. House Election History
California's delegation, the largest in the country, has been heavily Democratic for years, though a cluster of competitive seats in Orange County, the Central Valley, and inland Southern California has produced some of the closest House races in the nation. For most of the 2010s and 2020s the lines were drawn by an independent citizens' redistricting commission, created by voters in 2010 to keep partisan politics out of mapmaking.
That changed for 2026. In November 2025, voters approved Proposition 50, which suspended the commission and let the legislature redraw the map mid-decade as a Democratic answer to Republican gerrymanders in Texas and elsewhere, a redraw that survived federal court review and a Supreme Court denial. The new map converts up to five Republican-leaning seats into Democratic-leaning ones, pushing the delegation toward a roughly 43-9 Democratic split. The markets now track both the redrawn-district outcomes and the litigation and repeal efforts swirling around the map.
California Presidential Election Betting Odds
California's 54 electoral votes have gone Democratic in every presidential election since 1992. Harris won the state by 20 points in 2024, a smaller margin than Biden's 29-point win in 2020 but still the largest contribution any state made to her electoral college total. The decline from 29 points to 20 was driven by a roughly 10% drop in turnout from 2020 to 2024, with Los Angeles County alone losing 14% of its turnout, a story that Democratic operatives in the state have spent the past 18 months trying to understand and reverse.
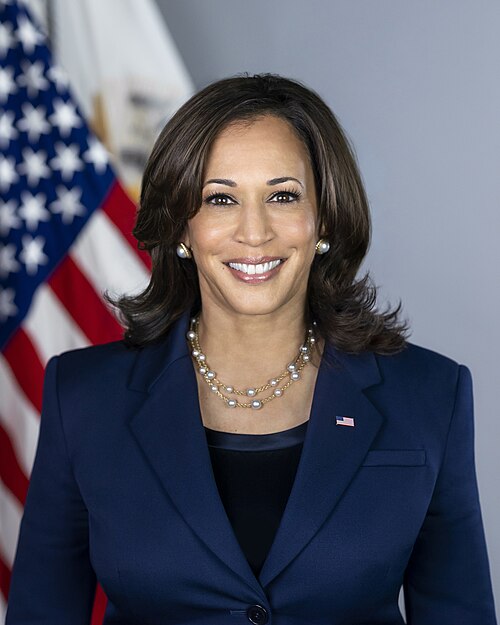
For 2028, California's significance to the prediction markets is less about which way it will go and more about which Californian carries the Democratic nomination. Gavin Newsom is a serious 2028 contender, and his term-limited departure from the governor's mansion in January 2027 sets him up for a national run. Senator Adam Schiff, sworn in in December 2024 after winning his first Senate election, is also occasionally mentioned in long-shot markets. Former Vice President Kamala Harris, a California native and former state attorney general and senator, remains in the 2028 frontrunner conversation despite her 2024 loss.
The markets pricing all of these candidates pull from California's underlying political base, and movement on California-specific issues, Proposition 50, the governor's primary outcome, the state's housing and crime numbers, can affect those national markets in ways that other state-level developments don't.


California Presidential Election History
California was a Republican-leaning presidential state for much of the 20th century, the home of Richard Nixon and Ronald Reagan, and it backed Republican nominees in most elections from 1952 through 1988. The realignment of the early 1990s, accelerated by the backlash to 1994's Proposition 187, changed everything. Bill Clinton carried the state in 1992, and no Republican has won it since.
The Democratic margins have been enormous, ranging from about 10 points in 2004 to 30 points in 2016, with Harris winning her home state by 20 in 2024 even as statewide turnout fell sharply from 2020. The 54 electoral votes, the largest single bloc in the country, anchor the Democratic Electoral College base. For 2028, every forecast and market places California safely in the Democratic column, and its national relevance is as a source of candidates and money rather than as a battleground.
California Political Props & Other Markets
State-specific prediction markets tied to California politics, like cabinet moves, resignations, and ballot questions.
Other markets
2 marketsCalifornia Political Polls
The polls below pull the latest 2026 survey data for California's marquee race, the wide-open June 2 governor primary. The most recent Emerson College poll showed Republican Steve Hilton and Chad Bianco alongside Democrats Tom Steyer, Xavier Becerra, and Katie Porter packed within a narrow band, with a large undecided share and no candidate breaking 20 percent.
Because California uses a top-two primary, the number that matters is not just who leads but which two candidates advance to November regardless of party, so watch the battle for the second slot as closely as the battle for first. Where a race has no recent public polling, that section will say so rather than show stale data.
California governor polls
| Pollster | Dates | Sample | Result |
|---|---|---|---|
| Kreate Strategies | June 13–17, 2026 | 900 (LV) | Xavier Becerra (D) 58% · Steve Hilton (R) 33% · Undecided 8% |
| 270toWin | May 14–31, 2026 | Xavier Becerra (D) 24% · Chad Bianco (R) 11% · Steve Hilton (R) 22.3% · Matt Mahan (D) 5.1% · Katie Porter (D) 7.3% · Tom Steyer (D) 19.9% · Antonio Villaraigosa (D) 2.7% · Other/ Undecided 7.7% | |
| RealClearPolitics | May 19–31, 2026 | Xavier Becerra (D) 23.6% · Chad Bianco (R) 10.9% · Steve Hilton (R) 22.9% · Matt Mahan (D) 5% · Katie Porter (D) 6.8% · Tom Steyer (D) 20.9% · Antonio Villaraigosa (D) 2.2% · Other/ Undecided 7.7% | |
| SurveyUSA | May 28–31, 2026 | 1,124 (LV) | Xavier Becerra (D) 17% · Chad Bianco (R) 11% · Steve Hilton (R) 20% · Matt Mahan (D) 6% · Katie Porter (D) 7% · Tom Steyer (D) 20% · Tony Thurmond (D) 2% · Antonio Villaraigosa (D) 4% · Other 1% · Undecided 12% |
| Emerson College | May 27–28, 2026 | 1,000 (LV) | Xavier Becerra (D) 28% · Chad Bianco (R) 12% · Steve Hilton (R) 23% · Matt Mahan (D) 5% · Katie Porter (D) 5% · Tom Steyer (D) 23% · Tony Thurmond (D) 1% · Antonio Villaraigosa (D) 3% · Other 1% |
| Public Policy Polling (D) | May 27–28, 2026 | 686 (LV) | Xavier Becerra (D) 18% · Chad Bianco (R) 14% · Steve Hilton (R) 20% · Matt Mahan (D) 7% · Katie Porter (D) 7% · Tom Steyer (D) 21% · Antonio Villaraigosa (D) 2% · Other 1% · Undecided 10% |
Polling data adapted from 2026 California gubernatorial election under CC-BY-SA 4.0. Last refreshed 22 minutes ago.
California U.S. Senate polls
No California U.S. Senate polls are currently available from public sources. This section will populate automatically when pollsters release new surveys for this race.
Frequently Asked Questions
Is California a red state or a blue state?
California is one of the bluest states in the country. Democrats have won every presidential election there since 1992 and every statewide office since 2010, Harris carried it by 20 points in 2024, and Cook PVI rates it D+13.
Who is running for California governor in 2026?
The race is wide open because Gavin Newsom is term-limited, with 61 candidates on the June 2 top-two primary ballot. Recent polling has shown Republicans Steve Hilton and Chad Bianco and Democrats Tom Steyer, Xavier Becerra, and Katie Porter clustered near the top after frontrunner Eric Swalwell exited the race.
What is Proposition 50?
Prop 50, approved by California voters with 64% support in November 2025, suspended the independent redistricting commission and let the legislature redraw the congressional map mid-decade, converting up to five Republican-leaning seats to Democratic-leaning ones. It was framed as a counter to Republican redistricting in Texas, Missouri, and Florida, and has survived its court challenges.
Is there a U.S. Senate race in California in 2026?
No. Both seats are held by Democrats and neither is up in 2026. Alex Padilla is next up in 2028 and Adam Schiff in 2030, so the governor's race and the 52 House seats are the focus.
Odds are aggregated from public prediction markets including Polymarket and Kalshi and are updated multiple times daily. They reflect real-money market pricing, not polling or editorial forecasts, and are provided for informational purposes only. ElectionOdds.com does not accept wagers.