
A complete reference to America's political geography. Maps, charts, rankings, demographics, and a state-by-state breakdown of how every state leans heading into the November midterms.
Balance of Power: Where Things Stand
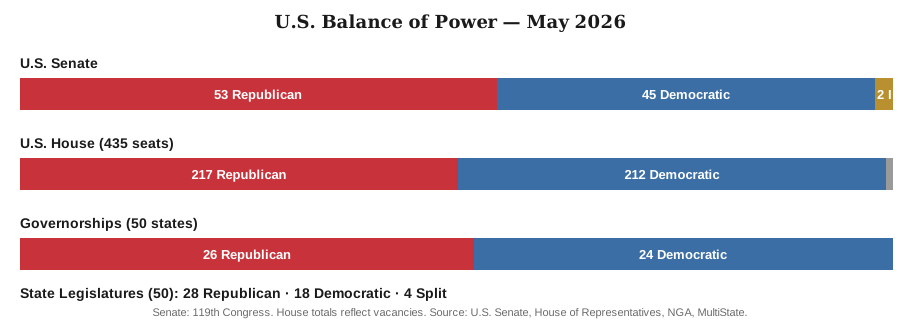
Republicans hold the slimmest of trifectas at the federal level entering the 2026 midterms, with single-digit margins in both the Senate and House and a 26-24 edge in governorships. The state-legislature picture is more lopsided in the GOP's favor: 28 states have Republican-controlled legislatures, 18 Democratic, and four are split.

The Map
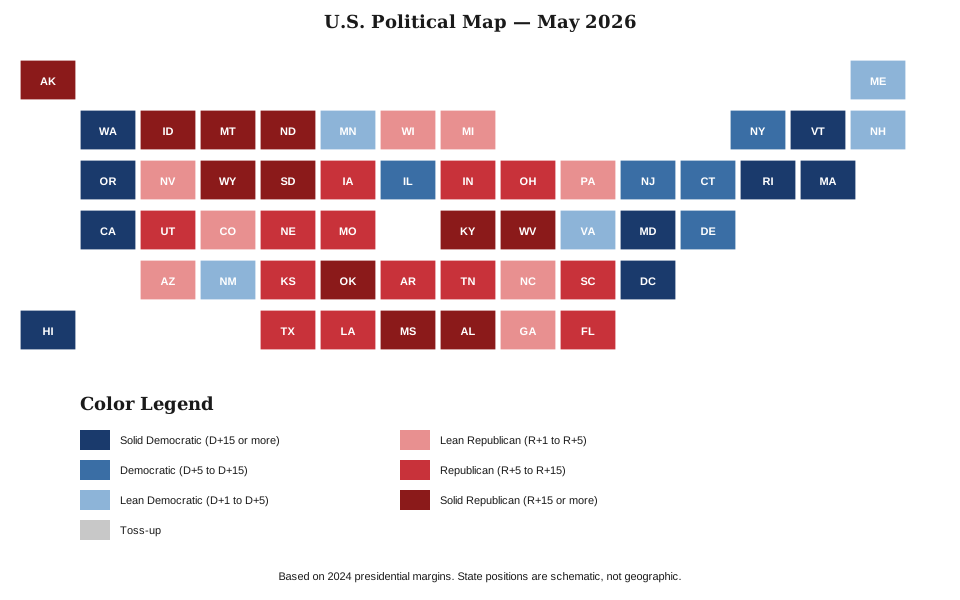
Below is the 2026 political landscape at a glance. Each state is colored by its overall partisan classification, which combines 2024 presidential margin, U.S. Senate composition, governor's party, and state legislature control. States with conflicting signals (like Kentucky, where Trump won by 31 points but the governor is a Democrat) are classified by the combined score.
The Top 10 Reddest States by 2024 Margin
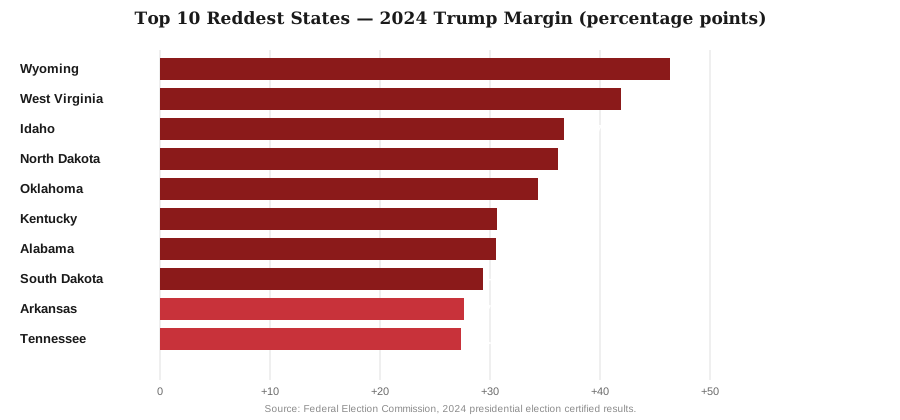
Ranked by margin of victory in the 2024 presidential election. The deepest red states are concentrated in the Mountain West and rural South.
The Top 10 Bluest States by 2024 Margin
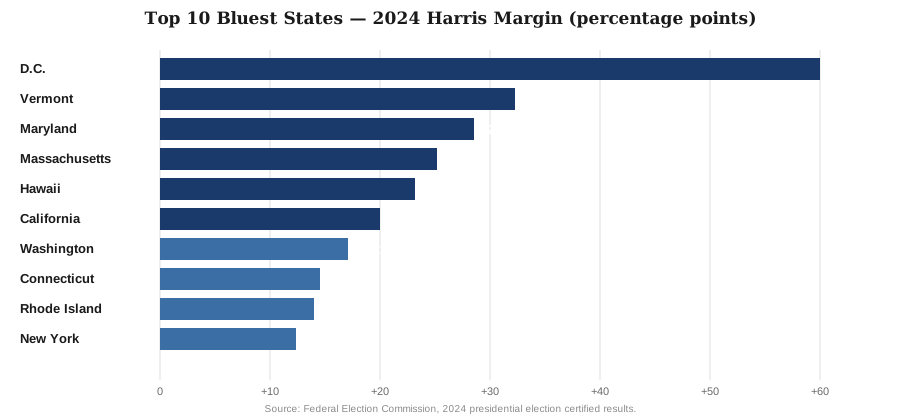
Ranked by margin of victory in the 2024 presidential election. The deepest blue states are concentrated in the Northeast, the Pacific Coast, and Hawaii.
How "Red" and "Blue" Get Measured
The terms "red state" and "blue state" are barely a generation old. Before the 2000 presidential election, television networks did not use consistent colors for the two parties; different networks used different schemes from year to year. The current pairing of Republicans with red and Democrats with blue traces specifically to NBC's election-night graphics in 2000, made memorable by Tim Russert's repeated reference to "red states" and "blue states" on air. Although the language is binary, the underlying reality is a spectrum, and there are at least four different ways political analysts measure how red or blue a state actually is.
1. Presidential Vote Margin
The simplest measure: the gap between the parties in the most recent presidential election. Wyoming voted for Trump by 46 points in 2024; Vermont voted for Harris by 32. The metric is a one-cycle snapshot and can mislead in states with strong ticket-splitting, like Kentucky.
2. Cook PVI
Cook PVI measures how a state leans compared with the national average. Cook averages the last two presidential elections to smooth single-cycle outliers. The PVI is the standard analytical reference for "structural" partisan lean.
3. Office Composition
Who currently holds the state's two Senate seats, governor's office, and legislative chambers. Maine looks more like a battleground here than its D+5 presidential margin suggests, since one senator is Republican and the governor is Democratic.
4. Trifecta Status
A trifecta exists when one party controls the governor's office plus both legislative chambers. In 2026, Republicans hold 23 trifectas, Democrats hold 17, 10 states are divided. Trifecta status best predicts which way a state's policy actually moves.
The Battleground States: Where 2024 Was Decided
The 6 to 8 states that decide presidential elections are also the states where the red-vs-blue framing breaks down the most. These states show split partisan control, narrow presidential margins, and frequent ticket-splitting. Below are the seven core 2024 swing states plus New Hampshire, ranked by how close the 2024 presidential margin was.
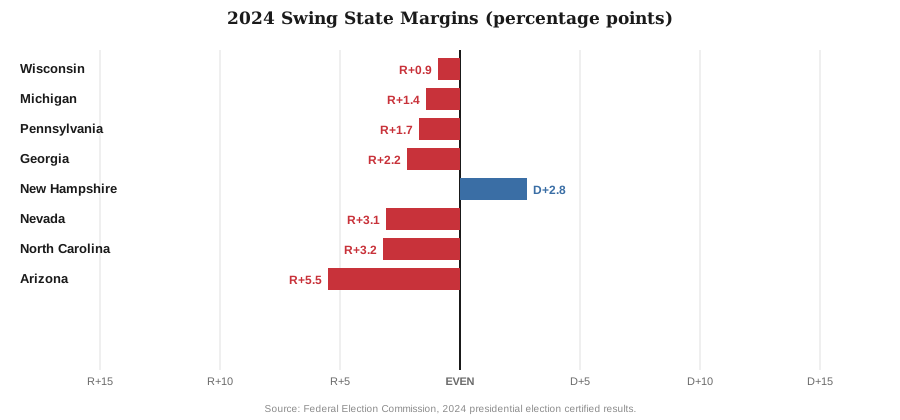
Wisconsin was the closest state in the country in 2024, decided by fewer than 30,000 votes. Trump won all seven of the traditional swing states (Arizona, Georgia, Michigan, Nevada, Pennsylvania, Wisconsin, North Carolina) by margins of 5.5 points or fewer; in three of them, the margin was under 2 points. New Hampshire was the only Harris-won state with a sub-3-point margin.
The Long Arc: How the Electoral Map Has Shifted
The political map has fundamentally inverted from where it sat in the mid-20th century. The South was Democratic at the federal level into the 1990s. New England was Republican into the 1980s. California was a swing state until 1992. The chart below shows electoral vote outcomes for every presidential election since 1988.
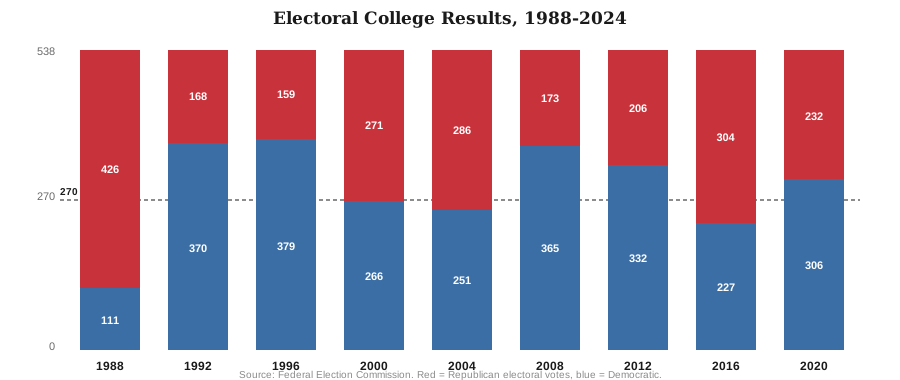
The chart reveals a partisan map that became dramatically more competitive after 2000. Bush's 1988 landslide (426 electoral votes) was the last election with more than 400 EVs won by a single candidate. Every election since 2000 has been decided by fewer than 100 electoral votes, and four of them (2000, 2004, 2016, 2020) by fewer than 75. The 2024 election extended that pattern: Trump won 312 to Harris's 226, an 86-vote margin that depended entirely on the seven swing states flipping in unison.
The Long Realignment: Four Phases Since 1968
The single most useful framing for the modern political map is that it has fundamentally inverted from where it sat in the mid-20th century. The realignment that produced today's map happened in roughly four phases.
The South Goes Red
Starting with Nixon's 1968 "Southern strategy" and accelerating after the Civil Rights Act, white Southern voters began voting Republican at the presidential level while still electing Democrats locally. As late as 1994, every Southern state had a Democratic-controlled state legislature. By 2014, every Southern state legislature was Republican.
New England Goes Blue
Vermont elected a Republican senator as recently as 1988. Maine elected Republican governors throughout the 1990s. The shift was driven by suburban affluent voters moving away from the GOP as the party's center of gravity moved south. By the 2010s, only Maine and New Hampshire retained meaningful Republican strength in New England.
The Sun Belt Goes Purple
Arizona, Georgia, Nevada, and North Carolina all became battlegrounds in this period, driven by suburban growth, in-migration from blue states, and Hispanic voter shifts. The Sun Belt's politics are the most volatile in the country, with each state flipping between parties multiple times since 2008.
The Industrial Midwest Flips
Pennsylvania, Michigan, and Wisconsin voted Democratic in every presidential election from 1992 to 2012, then voted for Trump in 2016, Biden in 2020, and Trump in 2024. They are now the most reliable indicator states of national partisan tides.
What Actually Makes a State Red or Blue
Political analysts have identified four demographic and structural factors that explain most of the variation between red and blue states. The chart below shows the typical pattern between each factor and a state's partisan lean.
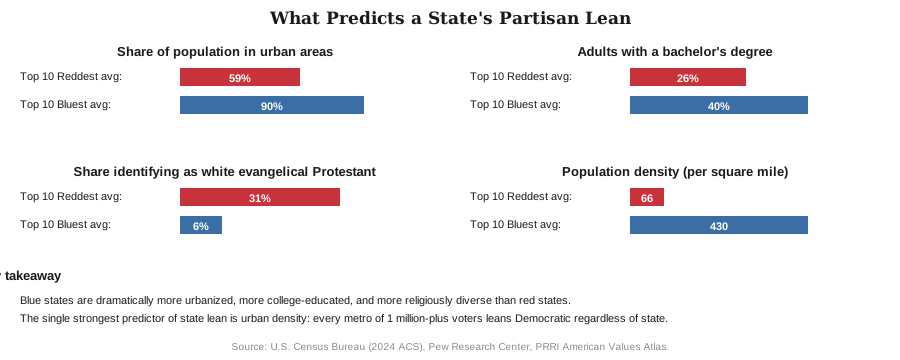
The single strongest predictor of a state's partisan lean is the share of its population living in dense metropolitan areas. In every state, urban counties vote Democratic and rural counties vote Republican. A state's overall lean is essentially a weighted average of how much of its population lives in each environment. New York, with 95 percent metro population, is solid Democratic. West Virginia, with 49 percent metro population (the lowest in the country), is solid Republican.
The second-strongest predictor is education: the gap between college-degree-holders and non-college voters has widened in every cycle since 2012 and was the most important demographic shift in 2024, when Republicans made historic gains among non-college voters of all races. The white evangelical Protestant share of a state's population predicts Republican lean almost as cleanly: Mississippi (33 percent white evangelical), Alabama (33 percent), and Tennessee (28 percent) are deep red. Massachusetts (3 percent), Connecticut (4 percent), and New York (5 percent) are deep blue.
Red State vs. Blue State Policy Map
The partisan division of states translates directly into different policy environments. The same family, business, or pregnant woman faces dramatically different rules depending on which side of a state line they sit on.
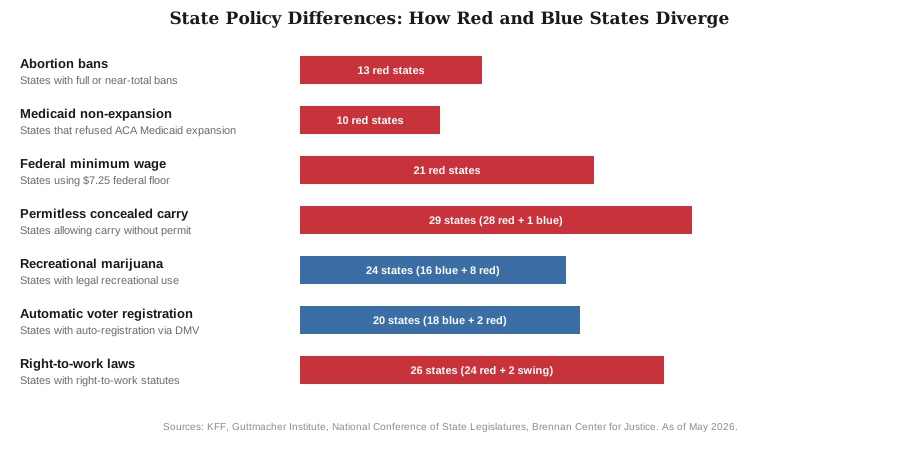
The policy patterns above produce some of the largest red-vs-blue state divides in modern American life. Since the Dobbs decision in 2022, abortion has become the cleanest policy divide: it is fully or mostly banned in 13 states, all solid Republican. Medicaid expansion under the Affordable Care Act is now in 41 states, with the 10 holdouts all Republican-controlled. The 21 states that still use the $7.25 federal minimum wage are all Republican-led, while blue states have raised their floors to between $13 and $17 per hour.
Red States, Blue States, and Battlegrounds in 2026
The simplest answer to "what states are red and what states are blue" is below. We classify based on a combination of 2024 presidential margin, Senate composition, governor's party, and state legislature control.
AlabamaAlaskaArkansasIdahoIndianaMississippiMissouriNorth DakotaOklahomaSouth CarolinaSouth DakotaTennesseeTexasUtahWest VirginiaWyoming
ArizonaGeorgiaMichiganNevadaNew HampshireNorth CarolinaPennsylvaniaWisconsin
The Full State-by-State Table
Every state, alphabetically, with the four key partisan indicators. Each state name links to its full prediction-market odds page.
| State | 2024 Margin | Senators | Governor | Legislature | Classification |
|---|---|---|---|---|---|
| Alabama | R+30.5 | 2R | R | R | Solid R |
| Alaska | R+13.0 | 2R | R | R | Solid R |
| Arizona | R+5.5 | 2D | D | R | Battleground |
| Arkansas | R+27.6 | 2R | R | R | Solid R |
| California | D+20.0 | 2D | D | D | Solid D |
| Colorado | D+11.0 | 2D | D | D | Solid D |
| Connecticut | D+14.5 | 2D | D | D | Solid D |
| Delaware | D+14.5 | 2D | D | D | Solid D |
| Florida | R+13.1 | 2R | R | R | Lean R |
| Georgia | R+2.2 | 2D | R | R | Battleground |
| Hawaii | D+23.2 | 2D | D | D | Solid D |
| Idaho | R+36.7 | 2R | R | R | Solid R |
| Illinois | D+10.9 | 2D | D | D | Solid D |
| Indiana | R+19.1 | 2R | R | R | Solid R |
| Iowa | R+13.2 | 2R | R | R | Lean R |
| Kansas | R+16.0 | 2R | D | R | Lean R |
| Kentucky | R+30.6 | 2R | D | R | Lean R |
| Louisiana | R+22.0 | 2R | R | R | Lean R |
| Maine | D+7.0 | 1R 1I | D | D | Lean D |
| Maryland | D+28.5 | 2D | D | D | Solid D |
| Massachusetts | D+25.2 | 2D | D | D | Solid D |
| Michigan | R+1.4 | 2D | D | Split | Battleground |
| Minnesota | D+4.3 | 2D | D | Split | Lean D |
| Mississippi | R+24.1 | 2R | R | R | Solid R |
| Missouri | R+18.5 | 2R | R | R | Solid R |
| Montana | R+20.5 | 2R | R | R | Lean R |
| Nebraska | R+20.2 | 2R | R | R | Lean R |
| Nevada | R+3.1 | 2D | R | D | Battleground |
| New Hampshire | D+2.8 | 2D | R | R | Battleground |
| New Jersey | D+5.9 | 2D | D | D | Solid D |
| New Mexico | D+5.5 | 2D | D | D | Lean D |
| New York | D+12.4 | 2D | D | D | Solid D |
| North Carolina | R+3.2 | 2R | D | R | Battleground |
| North Dakota | R+36.2 | 2R | R | R | Solid R |
| Ohio | R+11.2 | 2R | R | R | Lean R |
| Oklahoma | R+34.4 | 2R | R | R | Solid R |
| Oregon | D+13.9 | 2D | D | D | Solid D |
| Pennsylvania | R+1.7 | 1D 1R | D | Split | Battleground |
| Rhode Island | D+14.0 | 2D | D | D | Solid D |
| South Carolina | R+17.7 | 2R | R | R | Solid R |
| South Dakota | R+29.4 | 2R | R | R | Solid R |
| Tennessee | R+27.4 | 2R | R | R | Solid R |
| Texas | R+13.7 | 2R | R | R | Lean R |
| Utah | R+21.6 | 2R | R | R | Solid R |
| Vermont | D+32.3 | 1D 1I | R | D | Solid D |
| Virginia | D+5.8 | 2D | R | Split | Lean D |
| Washington | D+17.1 | 2D | D | D | Solid D |
| West Virginia | R+41.9 | 2R | R | R | Solid R |
| Wisconsin | R+0.9 | 1D 1R | D | R | Battleground |
| Wyoming | R+46.4 | 2R | R | R | Solid R |
Senators column: 2R = two Republicans; 2D = two Democrats; 1D 1R = split; 1D 1I or 1R 1I = one independent caucusing with that party. Vermont's Bernie Sanders and Maine's Angus King caucus with Democrats.
The 2026 Map: What Could Change This Year
The map above represents the political landscape entering the 2026 midterms. By November 2026, several classifications could change.
36 Governor Races
Several states are realistic flips: Georgia (open seat, GOP runoff in progress), Nevada (Republican incumbent Lombardo facing competitive Democratic challenge), and New Hampshire (open seat in a state that has split governor-Senate results) are the marquee battlegrounds.
35 Senate Seats
Democrats are defending more seats than Republicans in 2026, including in three states Trump carried (Georgia, Michigan, Pennsylvania). Republicans are defending Maine, where Sen. Collins faces her first competitive race in a decade, and North Carolina, where Sen. Tillis's retirement opened the seat that polling has Democrat Roy Cooper leading.
All 435 House Seats
Mid-decade redistricting in Texas, Ohio, Florida, Missouri, and North Carolina is the structural story of the 2026 House cycle. The Republican-led redraws are projected to net the GOP 7 to 12 seats compared with the maps used in 2024, even before votes are cast.
88 State Legislative Chambers
Most legislative chambers are on the 2026 ballot. The closest chambers to flipping are in Arizona, Michigan, New Hampshire, and Wisconsin. A flip in any single chamber can move a state from full party control to split control and change its trifecta status.
How Red or Blue Is Your State?
Want a quick read on any single state? Each state name on this page links to its full ElectionOdds.com profile with current Senate, House, and governor odds, recent polling, and primary calendar. The full state-by-state table above gives a one-row summary of where any state sits, and the alphabetical lists earlier on this page give a quick classification answer. If you are looking for primary dates, our 2026 state primary calendar covers every primary and runoff date on the 2026 calendar.
- Alabama
- Alaska
- Arizona
- Arkansas
- California
- Colorado
- Connecticut
- Delaware
- District of Columbia
- Florida
- Georgia
- Hawaii
- Idaho
- Illinois
- Indiana
- Iowa
- Kansas
- Kentucky
- Louisiana
- Maine
- Maryland
- Massachusetts
- Michigan
- Minnesota
- Mississippi
- Missouri
- Montana
- Nebraska
- Nevada
- New Hampshire
- New Jersey
- New Mexico
- New York
- North Carolina
- North Dakota
- Ohio
- Oklahoma
- Oregon
- Pennsylvania
- Rhode Island
- South Carolina
- South Dakota
- Tennessee
- Texas
- Utah
- Vermont
- Virginia
- Washington
- West Virginia
- Wisconsin
- Wyoming
Frequently Asked Questions
Why are Republicans red and Democrats blue?
The color convention is recent. Before 2000, television networks used different color schemes from year to year. NBC's 2000 election-night graphics paired Republicans with red and Democrats with blue, and Tim Russert's repeated use of "red states" and "blue states" on air made the pairing memorable enough that other networks adopted the same scheme by 2004. In most other countries, red is the traditional color of the political left, not the right. The American convention is essentially an accident of one network's graphics choice in one election.
What is the most Republican state? What is the most Democratic state?
By 2024 presidential margin, the most Republican state is Wyoming (Trump +46.4 points). The most Democratic state is Vermont (Harris +32.3 points), though the District of Columbia voted for Harris by 84 points. By Cook PVI, the most Republican is Wyoming (R+26) and the most Democratic is the District of Columbia (D+43). Both lists are stable from cycle to cycle.
Has any state always voted for the same party in presidential elections?
Since 1988, 20 states have voted for the same party in all 10 elections through 2024. The Republican states with that streak are Alabama, Alaska, Idaho, Kansas, Mississippi, Nebraska, North Dakota, Oklahoma, South Carolina, South Dakota, Texas, Utah, and Wyoming. The Democratic states with that streak are California, Connecticut, Hawaii, Illinois, Maryland, Massachusetts, Minnesota, New York, Rhode Island, Vermont, and Washington (plus the District of Columbia).
What is a "purple" or "swing" state?
A swing state is one that could be won by either major party in a presidential election. Sometimes called "purple," "battleground," or "tipping-point" states, they are the targets of essentially all presidential general-election campaign resources. The current 7 widely accepted swing states are Arizona, Georgia, Michigan, Nevada, Pennsylvania, Wisconsin, and North Carolina. New Hampshire has occasionally been added by some analysts as an eighth.
Can a state be red but have a Democratic governor?
Yes. In 2026 Kentucky (Beshear), Kansas (Kelly), and North Carolina (Stein) are red-state Democratic governors. The reverse also exists: Vermont (Scott) and New Hampshire (term-limited Sununu) are blue-state Republican governors. Gubernatorial races tend to turn more on individual candidate quality and state-level issues than on presidential partisanship, which is why ticket-splitting is more common in governor races than in any other major office.
How does the Cook PVI work?
Cook PVI measures how a state or congressional district has voted in the last two presidential elections relative to the national average. A state with an R+5 PVI voted 5 points more Republican than the national average across the last two cycles. PVI is the standard analytical reference for partisan lean because it averages out single-cycle swings and adjusts for national tides. The Cook Political Report updates its PVI calculations after every cycle.
What is a trifecta?
A trifecta exists when a single party controls the governor's office and both chambers of the state legislature, giving it unilateral control over the state's policy agenda. In 2026, Republicans hold 23 trifectas and Democrats hold 17, with 10 states having divided government. Trifecta status is the cleanest metric for predicting state policy outcomes.
Will the map look different after the 2026 midterms?
Probably in modest ways but not dramatic ones. The clearest possible changes are gubernatorial flips in Georgia, Nevada, or New Hampshire; a Senate flip in Maine or North Carolina; and state-legislature flips in Arizona, Michigan, or Wisconsin. None of these would move a state from solid red to solid blue or vice versa. The structural composition of the map is unlikely to change significantly until the 2028 presidential election produces a new round of state-level realignment evidence.
Methodology and Sources
Classifications on this page combine four data points per state: the 2024 presidential margin (from the Federal Election Commission), the current Cook Partisan Voting Index (Cook Political Report), the current composition of the state's U.S. Senate seats and governor's office, and the current composition of the state legislature (MultiState analysis). States with congruent signals across all four dimensions are classified Solid; states with one significant counterweight are classified Lean; states with multiple competing signals or recent close presidential margins are classified Battleground.
All data on this page is current as of May 24, 2026. We update the page after each election cycle and after any significant statewide partisan change. Each state name on this page links to the full ElectionOdds.com state profile, which includes current prediction-market odds for that state's 2026 races, recent polling, primary calendar, and historical voting trends.
For coverage of every primary on the 2026 calendar, see our state primary calendar. For live prediction-market odds across all federal races, see the ElectionOdds.com homepage.